121 ways to write a research proposal

Putting proposals together was more time consuming than I anticipated it to be. We realized that this was it. There’s more at stake now at this stage. We have to propose something that we can at least try to deliver. Still, it’s exciting that we get to sort of combine all that we’ve learnt and see how it applies to possible final projects. And while we occasionally take our research questions above and beyond, its safe to say that we are building skills of thinking outside the box. 

Moving from individual projects to a group proposal is tricky. The collection is large, and we’ve somehow been able to identify specific subject areas which intrigue us. We’ve started sifting through the proposals in order to find keywords that will guide us in coming up with an umbrella subject which will enable us to pursue our initial individual interests within it. Its important that we each enjoy this process and no one gets forced into dealing with *cough* Gephi an aspect they do not particularly enjoy. Thus a concern is how can we go forward without having to make strong compromises on our personal interests. I’m not exactly sure how we will do this, also considering that there is a high probability that our interests may change as we engage more with the collection. Despite this, I’m hopeful that we will make it work as Amherst students constantly do.

Looking for Buoys

This past week bumped up the amount of intensity not with the number of workshops, but with the increasing amount of self-scheduled time for deliverables, proposals, and general digging around in the archives. The proposals that we have come up with thus far have been in relation to a specific tool. Although this lens provided a narrow focus, we used this “limitation” as an anchor, a jumping-off point for research questions. Now that the methodology workshops have come to an end, we are set free in this ocean that is the student publications collection. But with this freedom comes the inevitable – where, and how, to begin? Yes, we have some tools (digital, mental, intellectual etc.) at our disposal, but the challenge now becomes knowing when to draw on them most effectively, first of all to minimize the risk of drowning.

A few topics of interest have emerged in the process: wartime Amherst, student protests, comedy over the years, and origins of the many publications. Although the group brainpower has generated these topics, the four of us has branched off to pursue what most intrigues us individually. The final product will be a group proposal, and at this point, we are trying to find threads that weave through all of our interests. We jokingly said that the main thread is “student publications.” After all, despite the diversity and range of topics and purpose, they sought to react to something in the world, and did so in their own way of expression, whether that be comedy, politics, arts, or creative writing.

Thinking about the people behind these publications helps me connect the most with this collection. Instead of seeing a stack of papers, separated into bland yellow folders, shuffled into austere grey boxes, I want a glimpse into why certain publications came into existence: what forces propelled their founders, and what challenges did they face in getting the final product published? In short, the context is the thing. While it is a Sisyphean task to track down every single reason that contributes to the beginning of each publication, I did stumble upon a few extensive first-issue editorials and other accompanying documents that discussed the circumstances of their origins. The two currently on my mind are Io, an unconventional literary magazine that accepted drafts in an effort to rebel against the supposedly elitist literary establishment at Amherst, and the Amherst Story Project, which emulated an NPR show of the same name to showcase the unique life stories of the Amherst community members.

 
I have not yet graduated to the stage where I’m thinking of how to incorporate digital tools, because I only know a small number of publications from writing abstracts for the collection. Although we are still in the brainstorming stage, with no ideas set in stone yet, the search has begun. Specifically, the search for an umbrella term for our final group project that is not “student publications.”

Digital Humanities: The Home Depot for the Hammer-abusing Researcher

When the only tool you have is a hammer, everything looks like a nail.

Such a phrase describes my research process prior to this internship. When embarking on a paper, I would frantically skim through documents, desperately writing any fact that could take up footnote space. It was inefficient and incoherent. Many a paper have come back marked “Too sporadic!”

Continue reading Digital Humanities: The Home Depot for the Hammer-abusing Researcher

It’s not me it’s you

The methodology workshops have definitely helped a great deal in understanding what we can do with the student publications. Though we do get hints and pieces of the collection from writing up abstracts, the workshops help us engage with it much differently and more thoughtfully. The deliverables for the most part have been crucial in guiding us through the tools. We’ve had enough practice by now to come up with a ‘system’. Mostly brainstorm on a google doc, vote, then proceed with identifying sources, digging into archives, regrouping and putting together our findings.

The digital exhibit and mapping workshops and deliverables were pretty straightforward. One of the problems we encountered working with both Omeka and Timemapper was having a standardized format with which to enter information so that the tools can yield a consistent pattern and results. But we figured it out and resolved it; though some brushing up on metadata fields is still much needed.

voyant
Voyant knots feature which essentially looks like a blind doodle . One of which none of us was able to figure out what purpose it serves.

My relationship with text analysis is superficial and complicated. While initially drawn in by the visualization tools in Voyant such as cirrus and links, Ilater realized felt like there was nothing deeper beyond what it offered at a surface level. Perhaps there’s more to learn, but so far, the text analysis tool doesn’t seem strong enough to stand on its own as the main tool in a digital project, its more supplementary,  rudimentary actually. I have to admit we struggled a bit coming up with abstracts for the text analysis deliverables, even having to move outside for inspiration.

However not all was lost. Topic modeling brought much more clarity to text analysis. I personally find it to be the most mind-blowing tool I have learnt about so far. First of all, MALLET a leading precedent for other forms of topic modeling software was borne in the pioneer valley, at Umass. On top of that, based on the project examples we looked at such as signs@40 and mining the dispatch , the uses are very versatile. Overall I would say one common thing about the workshops is that they reveal the research question doesn’t have to come first, it can come last. On top of that, the more I tools I learn about the more I notice that the research questions become open ended. We’ve shifted from asking what to why which opens up the possibilities for interesting research even wider.

I quite enjoyed working on Monday, where we pretty much had most of the day working on deliverables and digging through the archives on our own, so I am definitely looking forward to the project phase of the internship. I do expect however that I will run into mind-block situations similar to those that happened when working on text analysis as opposed to the other deliverables which have had much smoother brainstorming sessions. I also still don’t have any idea what shape or form my end project will end up taking but lets not come to that until we have to.


Playing Make Believe

Last week and this week, we learned a variety of tools related to digital humanities such as Omeka, TimeMapper, and worst of all, Voyant. Each methodology workshop was followed by a deliverable, a word used in the context of this internship to means: a work produced by playing make believe. We assume that we have an infinite amount of resources and time and dedication to the subject. For a span of two hours, we pretend that we are embarking on a long-term project, knowing that we do not have to commit. We wrap ourselves in the comfort blanket that tells us that we do not have worry about real-world limitations or wonder if this is a project we will be willing to do the next day. Without playing make believe with these tools through deliverables, I would not have had a complete understanding of the tools and their shortcomings. But as useful as deliverables have been, they have been false starts to the “real” project.

12832416_1761285267426596_8166831673596942480_n

As we are checking off the list of deliverables to deliver, I can sense that we are nearing the real start. We have glimpsed into the student publications, we have glanced around to see what interests us, and soon we will have to dive in. The deliverables have helped us get a general sense of what is in and not in the student publications, what we can and cannot do with them. But they have still remained in the realm of make believe. Like children playing house cannot fathom what it means to maintain a house and have responsibilities, I feel that we cannot fathom what lies ahead of us until we start.


Retreating to Advance

At the beginning of his post on the Digital Humanities, Trevor Owens asks whether should “Start with the question, the archive or the tool?”.  The answer he gives is that the digital humanities has no set starting point; The process is not rigid. In our work, I see a similarly fluid approach, despite being greenhorns to the field of DH. The only pattern is the lack of pattern.

Recalling how we planned (or are planning) our projects, I don’t see a strict order for our work. However, I do see a hierarchy of our considerations while brainstorming for each assignment. These priorities are only present briefly- we let them guide us in terms of the borders of first-draft thinking, but drop them once we actually begin moving forward. We can move anywhere within the boundaries and even push outward as long as we are doing research.

The considerations for the structure of our projects have generally followed this order:

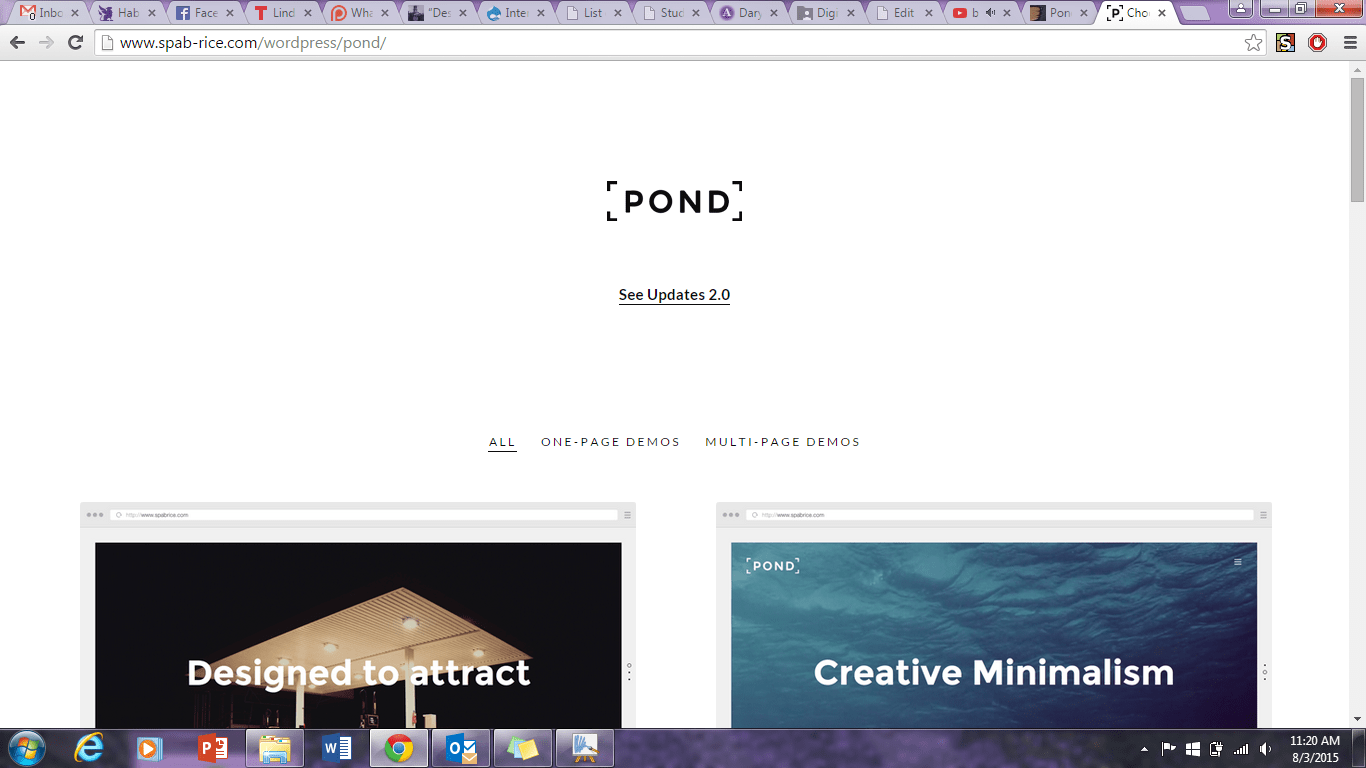
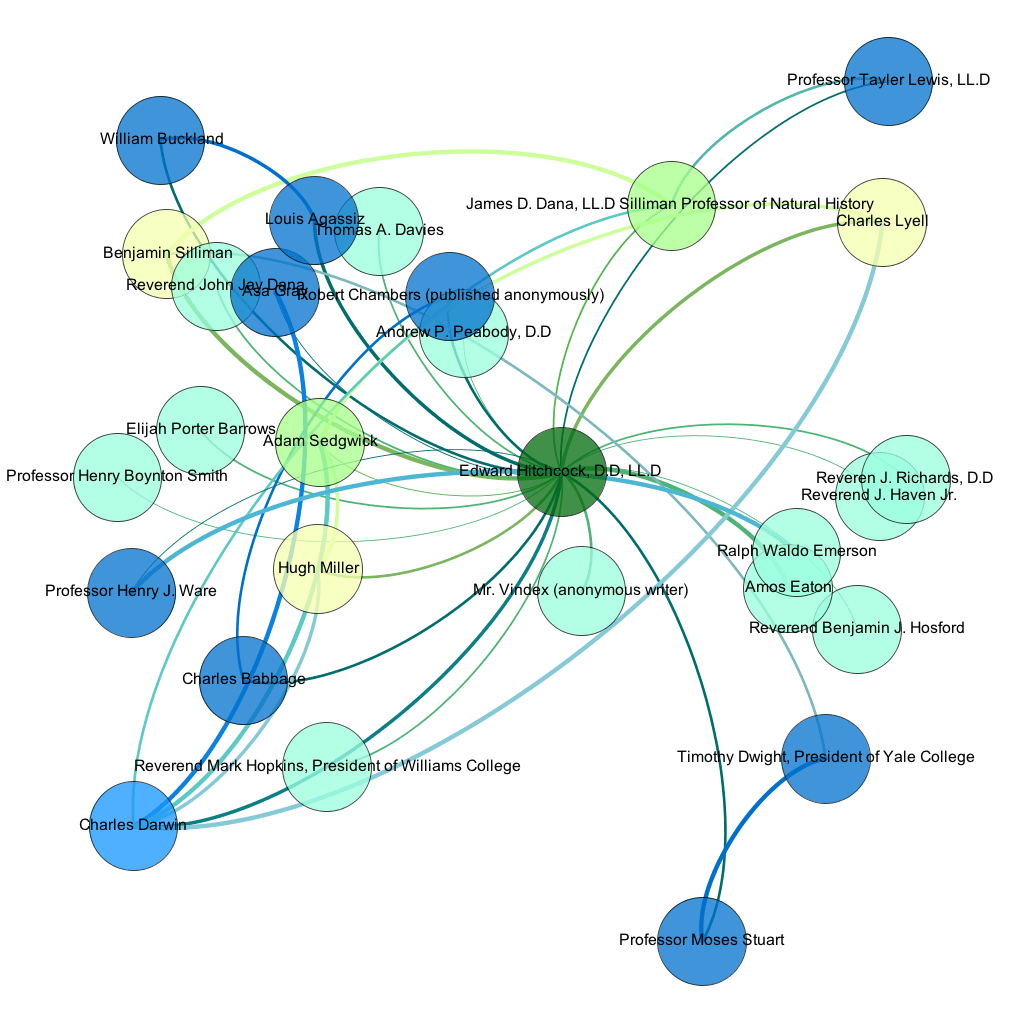
  • The tool that has been assigned.

Ex: WordPress, Omeka, Concept Mapping, Timemap, etc.

  • The sources that we can easily obtain

The materials in the Amherst College archives that we have access to and won’t take long to get, basically boxes 1-10 of the Student Publications

  • Topics and questions that we are both individually and collectively interested in

Architecture, music, biting satirical snark,which Val Dining Hall dishes are the worst, etc

In our TimeMap projects, for example, the priority was the tool first and the sources second. We knew that we had to make at least two maps using the TimeMap software and that our deliverables would pull data from the Student & Alumni Publications archives. The initial urge to map each publication and its period of distribution (the most basic application of TimeMap) was disqualified thanks to the nature of our archives. Every publication was from Amherst, which would be a very boring map.

However, we then reconsidered what we could pull from the publications and instead focus on their content. Undoubtedly, our favorite parts have been the humor mags and the Student’s weekly crime log. We were hoping to map each reference to a location on campus satirized by the range of publications. But with such a small range of locations within a small area, we weren’t certain of how accurately on a map we could distinguish each victim of college satire. We had to switch attention to further areas outside of the Amherst campus, such as Panama, New York or Manhattan.

Ultimately, this worked to our benefit. TimeMap, with the help of external GPS coordinate locators like google maps, was able to show individual locations on campus quite well. Still, we decided to keep looking for references to areas outside of Amherst as well, which gave extra breadth to our investigation. This adds more to interpretation of our project. Before, it would have only spoken about the areas on campus that students hated most by time period. Now, it can also answer questions like “How inwardly thinking where publications on campus?”, “What global events/locations were most in the eye of teen comedy writers?” and “Is Florida really the most ridiculous place on Earth?”

I don’t think the aforementioned considerations are inherent to digital humanities, but rather the framework for guided digital humanities. None of us are independent researchers yet; we’re all toddlers waiting to grow into the professor’s tweed jackets that we’re wearing. I’m doubtful that this hierarchy will remain when we reach the more free-form stage of the internship. Once the work-shops slow down and we begin pursuing our own projects, I’m excited to see what we come up with. We’re already thinking outside the box, imagine what we can do without a foot on the brakes.


Circles vs lines

My usual research process varies depending on the subject. In economics, my papers usually start with a statement in mind, then my research is geared towards supporting that statement. In my humanities courses, I usually start with the research first, then draw a thesis from all I have gathered, then do further research to support that thesis. This is especially helpful if there is absolutely no background in the research matter going in. What I’ve come to appreciate so far is that research is circular, and with such a large collection, it can definitely go off in any direction at any moment of time.

Start wherever, as long as where you start is anchored in your goals

This becomes even trickier when you aren’t quite sure what your goals are. The workshops have been quite eye-opening in the sense that they’ve sort of us given us hints of what direction we could take with the overall final deliverables of the internship. But the more I learn, the more I realize there’s more to learn. Which is exciting, but also kind of daunting for when it comes the time to align your goals and finally pursue a certain theme/publication.

I personally enjoyed the concept mapping most so far I had only come across it before in design thinking workshops and seeing it being applied in academia was something I hadn’t thought of before. The mapping examples we went through were very different from how I had encountered mapping before, which was through a more geographic lens, and not too much history embedded into it. Seeing it being used here opens up so much possibilities in my personal research aligned with my major here at Amherst, which I am excited about. On top of that the direction we took with the deliverables led us to shifting our focus to other publications which he hadn’t gotten a chance to look through yet, such as the Amherst Student. This again just reminded me of how not only the research guides the tool, but the tool can guide the research as well.

Update: Still unable to define digital humanities, but it is officially ingrained in my brain as a thing.

Optimistically confuzzled

As two separate words, “digital” and “humanities” do hold some meaning for this child of the digital generation, whose liberal-arts education leans liberally toward the humanities. But simply put those two words together, and poof! I am faced with a hazy sense of meaning, which is just a kinder way of saying that my knowledge on the matter is basically non-existent. Thankfully, the description for this Digital Scholarship internship reassures that “no prior technical or digital scholarship experience necessary, just curiosity and commitment.” After reading a number of articles, some of which attempt to clarify the scope of “digital humanities” while others argue for the futility of defining/delineating boundaries for the field, I find some comfort in the collective confusion, at least for these first two days.

In the last 36 hours, one word appears to best characterize my experience with digital scholarship this summer: fluidity. Digital humanities is inclusive in its ability to hover beyond the wall of definition, welcoming vast networks of scholars, projects, and methodologies. But with this fluidity comes more responsibilities. The first half of the internship will be devoted to exploring some of the tools available to digital humanists, but how do I allow the tools to enrich my research project rather than to dictate it? There is a limit to what we interns can learn and apply in the first few weeks, so how does one even begin to maintain a conversation between the digital and traditional aspects of the research process? What kind of questions would take advantage of the potential of digital technology and yield insights that traditional research for a paper could not?

My first foray into the library’s archives yesterday was a mix of glee (combing through just a few boxes of student publications revealed some bizarre ads and an interesting sense of humor in the late 1800s) and apprehension (how can I synthesize all the information in this collection of 36 boxes occupying 90 linear feet?). The obvious challenge of diving into a collection of this size and variety is how to navigate it all effectively: do I studiously go through all of the boxes (a bit ambitious… just a bit), hoping to stumble onto interesting threads one day? Do I identify a theme or question beforehand? Do I take notes of interesting tidbits and try to weave a pattern throughout? Or do I view the brainstorming process through the digital tools that we will learn, thinking about how they can be applied in the formation of my questions? In short, how should I take advantage of the interdisciplinary potential of a digital project? And thinking about the end product, which hopefully will be a concrete presentation-ready thing, what would the experience be like for an audience unfamiliar with digital scholarship?

Just drowning in questions… Be back in a mo’

As much as I anticipate the long periods of ambiguity, confusion, and perhaps existential crisis this summer, I do look forward to experiencing them all (just with my fingers crossed for the light at the end of this purple tunnel of ambiguity). Who knows, maybe I will be able to define what “digital humanities” mean(s)… to me.

Switching Strategies as the Tornado Appraoches

(The tornado is the looming deadline that is this Friday. I am the one laughing. Hopefully I am the one laughing. Hopefully.)

Blog Post: Consider the differences between digital and traditional scholarship, drawing from your experiences over the summer and in your previous academic life.

My research seems the most traditional of the group; my research and information-gathering has reached a very usual process and conclusion: sit, read things, gather information, try to reach an end point that explains all the work done before. I met with Kelcy and Sarah about this  sudden stop-point. I wasn’t feeling too excited about the only possible way to show my data-gathering over the last couple weeks. In any other situation, I would condense all my notes and thoughts into an essay. Because this is digital scholarship, I want to at least try and use some interesting methodology, some tool that would make this information visible ~in a new light~. After much brooding over Neatline, ArcGIS, and Omeka, my dissatisfaction with each of the methodologies stemmed that I was trying to change my information for the tool, not the other way around. I was considering using the tools for the sake of the tool  – that was definitely out of line from the general guidelines we drew up during the first couple weeks of the internship: the tool was meant to enhance the data, not the data existing for the sake of the tool. So out go all those ways of showing the data: Neatline was cool, but I see no reason to use a geographical tool for 4 buildings on the same small plot of land. :/ ArcGIS was just WAY to big and extensive  for the small project I aiming for. Omeka… is… Omeka… Just… Look at it and know that it is not am appealing project host…

I had accepted my not-too-interesting project format. If the natural traditional form of my research would be an essay, the natural digital form would be an exhibit. With the incredibly visual focus of the collecction and the archive in general, this is a path that works. The WordPress theme we have chosen – Pond – has a gallery feature that can function as an exhibit.

Looking nice B-)
Looking nice B-)

(Ive just realized this post has no bulletpoints. Go me.)

From my conversation with Kelcy and Sarah I also narrowed my scope once more, going from 11 buildings constructed during Hitchcock’s time at Amherst to 4 that are the most interesting examples of his impact on architecture (Morgan Library, Appleton Cabinet, the President’s House, and the Octagon) to just one – the Octagon. (The process reminded me quite a lot of the phrase “You could stop at five or six stores… or just one“)

So my choice is now only one. The most interesting one. The most ~*^iconic^*~ one (I guess living on campus really dulls your appreciation for the aesthetics of the more common wow-architecture? I remember arriving and being like “Wow! Octagon!”  and that is definitely no longer the case).

Anyways, I am now completely narrowing down. Putting that info in with gr8 pictures. Finding some conclusions about Hitch’s involvement into WordPress. Yes. That is the plan.

m/

Send Help Seanna is Dying Over Here

So I’m prefacing this post with the fact that I’m now two weeks late and I have technically been working on it since the original assignment date, but that there is just sooooooo much work to be done that I then put this off. Coincidentally, I still have so much work to get done that this will be a brief post. (Yes, even more brief than usual heheh) Commence original post: (by the way, Daniel came up with the title of this post so I can’t even take credit for that heheh)

So we’re onto week 8 and last week was our designated data collection period, in preparation for the final project. Up to this point, we’ve been doing quite a bit of individual work, seeking out data and doing some preliminary organization before we really dig in, convening merely to bounce ideas off of each other and to discuss possible platforms on which our final project will live. We’re winding down now, and the pressure is on in terms of making this cohesive project actually materialize. Personally, my week of data collection was long and painful, but in the best way possible. The methodology with which I approached my specific project (the conversations on the overlaps in science and Christianity during Hitchcock’s career) was to go start by going through the tables of contents of publications in which Hitchcock himself had frequently published in an effort to gather a list of relevant names for a possible mapping and network analysis visualization. I found the publications which I would use through some secondary source research (again, thank you Stanley Guralnick for all of your footwork) and then went though the tables of contents for each, lifting the names of scholars specifically talking about things relevant to Hitchcock’s own writings. Some of Hitchcock’s own interests included the timetable of the Six Days of Creation, Miracles, and the deluge. His overall philosophy was that every word of the scripture could be somehow illuminated or proven directly through the exploration of natural science.

Edward Hitchcock Social Network Analysis (1)

Here is a not-as-intuitive-as-I-would-like preview of one of the visualizations that I created (in lieu of finishing this post on time, of course) I used Gephi to create this particular visualization, and it took about half an hour to get the nodes and edges (circles and lines haha) to appear, and then the duration of my day to get the labels to appear. Needless to say, I underestimated how long it would take and how difficult it would be get my desired results after gathering and mining my data. But then again, who WOULD anticipate taking almost six hours to make a few names pop up on a visual? Am I just the clueless one? I digress.

In any case, we’re starting to come back together now that we will need to have our website assembled VERRRRRRRYYYY soon. We’ve done some post-it note models of the information architecture and began discussing what times of information we will need to provide in order to give context and unity to our four smaller projects. It feels like quite a time crunch, but I am quite confident in our team and our ability to pull it together. In the meantime, I need to make these visualizations more comprehensible and pretty. So until the next post!