Armed for Inquiry

I am not mathematically minded. After my Precalc midterm, my teacher looked at me with a mix of awe and disappointment and asked, “Katie, what happened?” I forged through Psych Statistics wielding rote memorization like a machete. No matter how many times I order the exact same meal at Fresh Side, I still have to break out my calculator app to figure out the tip.

Despite this… I love data.

I also love intuition– the spectral webs of crisscrossing themes and the cotton candy feel of abstract ideas spinning together.

But there’s something exciting about boiling down complex ideas into simple, manipulatable numbers. To see those intuitions finally concrete in scatterplots and percentages– or else thereby denied and replaced by a new realm of phantasmagoric possibilities.

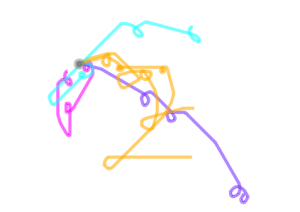
This love of data has been amplified by the various methodology workshops we’ve been doing. Learning about tools like Voyant and MALLET, the ways they can act as not a substitute for analysis but as a supplement or stimulus, and looking at data visualization, the way arguments can be made in images– all of it has been exhilarating. There are so many paths to walk down that ultimately I don’t feel terrible about having to narrow it down to just a few; there are thousands of good and great options, sure, but I just have to find the right ones.

Data exists everywhere– these workshops have convinced me of that. They’ve given me a new way of looking at our archival resources– inaugural speeches can be analyzed for trends, student publications can be broken down into topics, course catalogs can be distilled into graphs, charts, numbers. I’ve always been one to value the anecdote and its place in painting abstract ideas– now I realize that as beautiful as broad strokes are, there’s also power in pointillism.

Me, looking for the right paths and armed for the expedition.

So I’m ready to move on from frolicking to focusing– both have their merits– and to start circling in on a final topic. I have all these new, powerful methodologies– I want to sic them on something.

And I feel prepared for the journey– I’ve been armed for inquiry, I’ve got a great team beside me, and I’m eagerly awaiting the challenges ahead.

After all, we’re dealing in data, and data is fun.

It’s not me it’s you

The methodology workshops have definitely helped a great deal in understanding what we can do with the student publications. Though we do get hints and pieces of the collection from writing up abstracts, the workshops help us engage with it much differently and more thoughtfully. The deliverables for the most part have been crucial in guiding us through the tools. We’ve had enough practice by now to come up with a ‘system’. Mostly brainstorm on a google doc, vote, then proceed with identifying sources, digging into archives, regrouping and putting together our findings.

The digital exhibit and mapping workshops and deliverables were pretty straightforward. One of the problems we encountered working with both Omeka and Timemapper was having a standardized format with which to enter information so that the tools can yield a consistent pattern and results. But we figured it out and resolved it; though some brushing up on metadata fields is still much needed.

voyant
Voyant knots feature which essentially looks like a blind doodle . One of which none of us was able to figure out what purpose it serves.

My relationship with text analysis is superficial and complicated. While initially drawn in by the visualization tools in Voyant such as cirrus and links, Ilater realized felt like there was nothing deeper beyond what it offered at a surface level. Perhaps there’s more to learn, but so far, the text analysis tool doesn’t seem strong enough to stand on its own as the main tool in a digital project, its more supplementary,  rudimentary actually. I have to admit we struggled a bit coming up with abstracts for the text analysis deliverables, even having to move outside for inspiration.

However not all was lost. Topic modeling brought much more clarity to text analysis. I personally find it to be the most mind-blowing tool I have learnt about so far. First of all, MALLET a leading precedent for other forms of topic modeling software was borne in the pioneer valley, at Umass. On top of that, based on the project examples we looked at such as signs@40 and mining the dispatch , the uses are very versatile. Overall I would say one common thing about the workshops is that they reveal the research question doesn’t have to come first, it can come last. On top of that, the more I tools I learn about the more I notice that the research questions become open ended. We’ve shifted from asking what to why which opens up the possibilities for interesting research even wider.

I quite enjoyed working on Monday, where we pretty much had most of the day working on deliverables and digging through the archives on our own, so I am definitely looking forward to the project phase of the internship. I do expect however that I will run into mind-block situations similar to those that happened when working on text analysis as opposed to the other deliverables which have had much smoother brainstorming sessions. I also still don’t have any idea what shape or form my end project will end up taking but lets not come to that until we have to.


Circles vs lines

My usual research process varies depending on the subject. In economics, my papers usually start with a statement in mind, then my research is geared towards supporting that statement. In my humanities courses, I usually start with the research first, then draw a thesis from all I have gathered, then do further research to support that thesis. This is especially helpful if there is absolutely no background in the research matter going in. What I’ve come to appreciate so far is that research is circular, and with such a large collection, it can definitely go off in any direction at any moment of time.

Start wherever, as long as where you start is anchored in your goals

This becomes even trickier when you aren’t quite sure what your goals are. The workshops have been quite eye-opening in the sense that they’ve sort of us given us hints of what direction we could take with the overall final deliverables of the internship. But the more I learn, the more I realize there’s more to learn. Which is exciting, but also kind of daunting for when it comes the time to align your goals and finally pursue a certain theme/publication.

I personally enjoyed the concept mapping most so far I had only come across it before in design thinking workshops and seeing it being applied in academia was something I hadn’t thought of before. The mapping examples we went through were very different from how I had encountered mapping before, which was through a more geographic lens, and not too much history embedded into it. Seeing it being used here opens up so much possibilities in my personal research aligned with my major here at Amherst, which I am excited about. On top of that the direction we took with the deliverables led us to shifting our focus to other publications which he hadn’t gotten a chance to look through yet, such as the Amherst Student. This again just reminded me of how not only the research guides the tool, but the tool can guide the research as well.

Update: Still unable to define digital humanities, but it is officially ingrained in my brain as a thing.