
So I’m prefacing this post with the fact that I’m now two weeks late and I have technically been working on it since the original assignment date, but that there is just sooooooo much work to be done that I then put this off. Coincidentally, I still have so much work to get done that this will be a brief post. (Yes, even more brief than usual heheh) Commence original post: (by the way, Daniel came up with the title of this post so I can’t even take credit for that heheh)
So we’re onto week 8 and last week was our designated data collection period, in preparation for the final project. Up to this point, we’ve been doing quite a bit of individual work, seeking out data and doing some preliminary organization before we really dig in, convening merely to bounce ideas off of each other and to discuss possible platforms on which our final project will live. We’re winding down now, and the pressure is on in terms of making this cohesive project actually materialize. Personally, my week of data collection was long and painful, but in the best way possible. The methodology with which I approached my specific project (the conversations on the overlaps in science and Christianity during Hitchcock’s career) was to go start by going through the tables of contents of publications in which Hitchcock himself had frequently published in an effort to gather a list of relevant names for a possible mapping and network analysis visualization. I found the publications which I would use through some secondary source research (again, thank you Stanley Guralnick for all of your footwork) and then went though the tables of contents for each, lifting the names of scholars specifically talking about things relevant to Hitchcock’s own writings. Some of Hitchcock’s own interests included the timetable of the Six Days of Creation, Miracles, and the deluge. His overall philosophy was that every word of the scripture could be somehow illuminated or proven directly through the exploration of natural science.
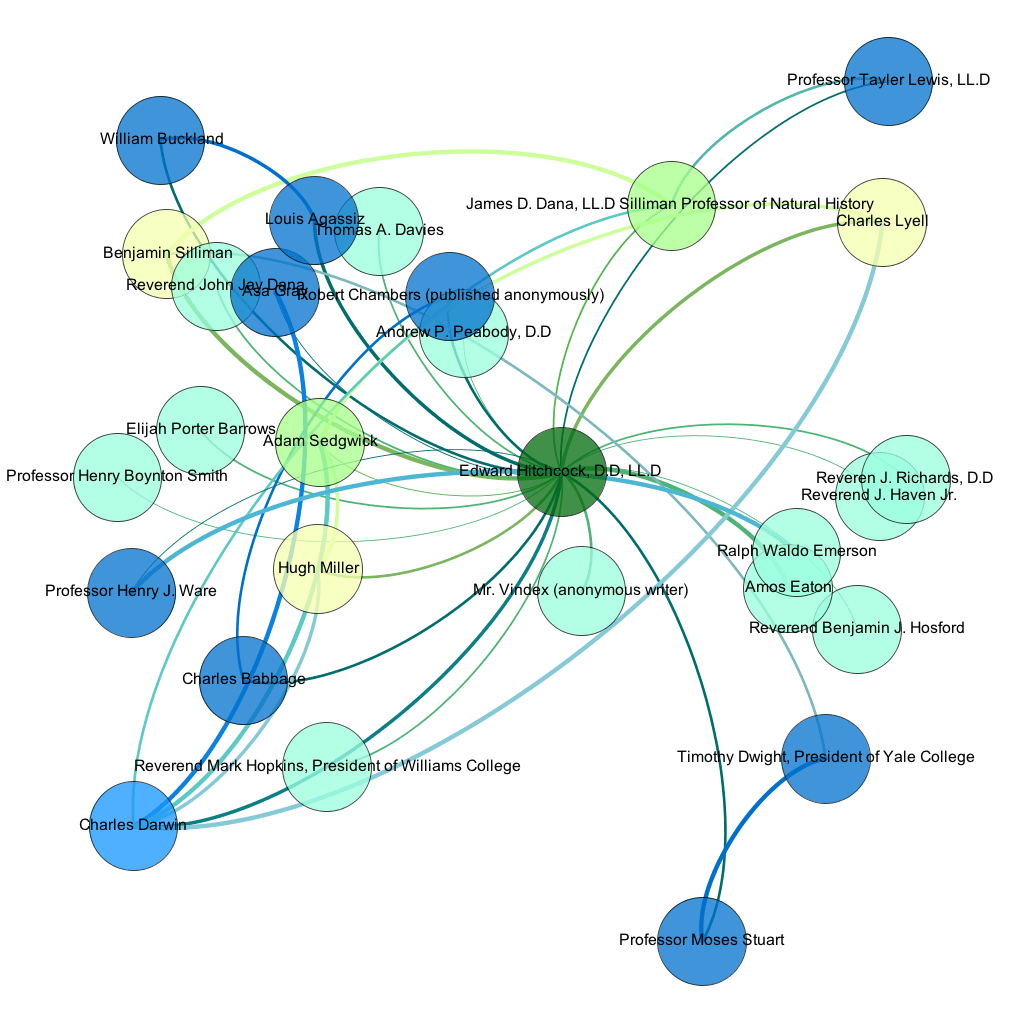
Here is a not-as-intuitive-as-I-would-like preview of one of the visualizations that I created (in lieu of finishing this post on time, of course) I used Gephi to create this particular visualization, and it took about half an hour to get the nodes and edges (circles and lines haha) to appear, and then the duration of my day to get the labels to appear. Needless to say, I underestimated how long it would take and how difficult it would be get my desired results after gathering and mining my data. But then again, who WOULD anticipate taking almost six hours to make a few names pop up on a visual? Am I just the clueless one? I digress.
In any case, we’re starting to come back together now that we will need to have our website assembled VERRRRRRRYYYY soon. We’ve done some post-it note models of the information architecture and began discussing what times of information we will need to provide in order to give context and unity to our four smaller projects. It feels like quite a time crunch, but I am quite confident in our team and our ability to pull it together. In the meantime, I need to make these visualizations more comprehensible and pretty. So until the next post!