Circles vs lines

My usual research process varies depending on the subject. In economics, my papers usually start with a statement in mind, then my research is geared towards supporting that statement. In my humanities courses, I usually start with the research first, then draw a thesis from all I have gathered, then do further research to support that thesis. This is especially helpful if there is absolutely no background in the research matter going in. What I’ve come to appreciate so far is that research is circular, and with such a large collection, it can definitely go off in any direction at any moment of time.

Start wherever, as long as where you start is anchored in your goals

This becomes even trickier when you aren’t quite sure what your goals are. The workshops have been quite eye-opening in the sense that they’ve sort of us given us hints of what direction we could take with the overall final deliverables of the internship. But the more I learn, the more I realize there’s more to learn. Which is exciting, but also kind of daunting for when it comes the time to align your goals and finally pursue a certain theme/publication.

I personally enjoyed the concept mapping most so far I had only come across it before in design thinking workshops and seeing it being applied in academia was something I hadn’t thought of before. The mapping examples we went through were very different from how I had encountered mapping before, which was through a more geographic lens, and not too much history embedded into it. Seeing it being used here opens up so much possibilities in my personal research aligned with my major here at Amherst, which I am excited about. On top of that the direction we took with the deliverables led us to shifting our focus to other publications which he hadn’t gotten a chance to look through yet, such as the Amherst Student. This again just reminded me of how not only the research guides the tool, but the tool can guide the research as well.

Update: Still unable to define digital humanities, but it is officially ingrained in my brain as a thing.

Are you a 1910 Slang Word? Because You’re “Jamake”-ing Me Crazy

Despite all the Digital Humanities concepts, ideas and jargon thrown at us within our first 48 hours of internship, one question dominated my mind this morning.

“What the heck is a ‘Jamake’?”

I’d encountered the term while reading the Kidder, a 1912 humor zine that was quite sophomoric for the time (although I’d argue that all publications in a college should be at the very least 25% sophomoric, if only for proper class-year representation.) The student editor, one Frederick Barton, had sent a draft to esteemed writer and troublemaker Elbert Hubbard. Hubbard, impressed with the rebellious display, wrote a kind letter in response. The editors would run Hubbard’s approval in the same issue, a trophy of witty delinquency.

Barton

Remember the good ol' days when world renowned authors invited you to sip lemonade on their porch because of your college magazine? I'm still waiting to hear back, Margaret Atwood. 

Reading his kind regards, I was left wondering what quality “jamake” could describe. Google searches turned up nothing. I texted my grandma at lunch and she never responded (crossing finger she didn’t pass away but too right now too call). Not until later did I realize the truth.

Jamake is plural.

The singular is “Jamoke,” a slang term from the late 19th century to describe a fool. The phrase arose from Irish American slang, particularly those working in shipping ports. It’s a combination of java and mocha, new words in America that had yet to be made cliche by Starbucks. To call someone a jamoke, apparently, is to say they no greater mind than that of a cup of coffee. It would rise to prominence in the trenches as slang for an army men, and like Tang, classic rock and the US presidency, would pick-up a less savory definition in the 70s.

Questions like these make me excited to spend real time looking at Amherst’s publications (unfortunately it’s not quite as easy to appreciate that old, mildewy book smell when you’ve gone digital.) I’ve written for a good number of our papers and magazines, but one thing I’ve found lacking is a sense of community and history within them. Students email their drafts, never step a foot in the office and don’t even know each others names. If it weren’t for the icons attached to their gmail address, I wouldn’t even know my editor’s faces.

My guess is that it’s hard to talk about legendary writers for The Student because it boasts such a massive, unwieldy history. Publication controversies, successes and tragedies come and go, but aren’t well recorded because they are ultimately covered up with the slog of boring candid sports photos and fluff news pieces. If an American icon were to contact a publication I wrote for, it probably wouldn’t even trickle down to my level. It seems a little ironic how the gatekeepers of Amherst’s daily history, have almost no knowledge of their own past. That’s all a little bit too selfless for me. Hopefully this jamoke can rectify it.

Optimistically confuzzled

As two separate words, “digital” and “humanities” do hold some meaning for this child of the digital generation, whose liberal-arts education leans liberally toward the humanities. But simply put those two words together, and poof! I am faced with a hazy sense of meaning, which is just a kinder way of saying that my knowledge on the matter is basically non-existent. Thankfully, the description for this Digital Scholarship internship reassures that “no prior technical or digital scholarship experience necessary, just curiosity and commitment.” After reading a number of articles, some of which attempt to clarify the scope of “digital humanities” while others argue for the futility of defining/delineating boundaries for the field, I find some comfort in the collective confusion, at least for these first two days.

In the last 36 hours, one word appears to best characterize my experience with digital scholarship this summer: fluidity. Digital humanities is inclusive in its ability to hover beyond the wall of definition, welcoming vast networks of scholars, projects, and methodologies. But with this fluidity comes more responsibilities. The first half of the internship will be devoted to exploring some of the tools available to digital humanists, but how do I allow the tools to enrich my research project rather than to dictate it? There is a limit to what we interns can learn and apply in the first few weeks, so how does one even begin to maintain a conversation between the digital and traditional aspects of the research process? What kind of questions would take advantage of the potential of digital technology and yield insights that traditional research for a paper could not?

My first foray into the library’s archives yesterday was a mix of glee (combing through just a few boxes of student publications revealed some bizarre ads and an interesting sense of humor in the late 1800s) and apprehension (how can I synthesize all the information in this collection of 36 boxes occupying 90 linear feet?). The obvious challenge of diving into a collection of this size and variety is how to navigate it all effectively: do I studiously go through all of the boxes (a bit ambitious… just a bit), hoping to stumble onto interesting threads one day? Do I identify a theme or question beforehand? Do I take notes of interesting tidbits and try to weave a pattern throughout? Or do I view the brainstorming process through the digital tools that we will learn, thinking about how they can be applied in the formation of my questions? In short, how should I take advantage of the interdisciplinary potential of a digital project? And thinking about the end product, which hopefully will be a concrete presentation-ready thing, what would the experience be like for an audience unfamiliar with digital scholarship?

Just drowning in questions… Be back in a mo’

As much as I anticipate the long periods of ambiguity, confusion, and perhaps existential crisis this summer, I do look forward to experiencing them all (just with my fingers crossed for the light at the end of this purple tunnel of ambiguity). Who knows, maybe I will be able to define what “digital humanities” mean(s)… to me.

Digging in

“… digital humanities, with a culture that values collaboration, openness, nonhierarchial relations, and agility, might be an instrument for real resistance or reform.”              – Matthew Kirschenbaum

The struggle to define digital humanities reflects its wide scope of possibilities and potential for growth, and in its ambiguous boundaries lies its definition. Kirschenbaum tries to explain, “Digital humanities is more akin to a common methodological outlook than an investment in any one specific set of texts or even technologies.” Advancement of technology will and have been changing the contours of digital humanities, but what should remain consistent is the willingness to incorporate digital tools to advance academia. This attitude has allowed digital humanities to expand and be accepted in academic environments, and the proliferation of projects implementing digital humanities in the past decade is a true testament to this dedication.

In the context of this Digital Scholarship Internship, I am struggling to comprehend the meaning of digital humanities and how this term translates when digging into student publications in the Special Archives. I see this internship as an opportunity examine the history and culture of the Amherst student body, especially during contentious times, and use digital methodologies to make this information accessible to the public. At this moment, trying to find what I want in the student publications collection seems like trying to find a needle in a haystack. But in hopes that aiming high will get me somewhere close, I will say that I want to find student publications that reflected or shaped the Amherst administration, such as admitting women, increasing diversity, changing financial aid to need blind, implementing a Black Studies major, and more. I hope that by focusing on the past impact of student voices, it will encourage future classes of Amherst College to speak out for change, using the past as precedents for their struggle and success.

C- Level

So am I kitty, so am I…

At this point in time I think I’m going to speak about what I know  how I feel thus far (since I don’t feel like I know anything just yet). I think I have a better understanding of what digital humanities is/are today than I did last week, but a far cry from being able to articulate it to someone who has no idea what it is.

Continue reading C- Level

Switching Strategies as the Tornado Appraoches

(The tornado is the looming deadline that is this Friday. I am the one laughing. Hopefully I am the one laughing. Hopefully.)

Blog Post: Consider the differences between digital and traditional scholarship, drawing from your experiences over the summer and in your previous academic life.

My research seems the most traditional of the group; my research and information-gathering has reached a very usual process and conclusion: sit, read things, gather information, try to reach an end point that explains all the work done before. I met with Kelcy and Sarah about this  sudden stop-point. I wasn’t feeling too excited about the only possible way to show my data-gathering over the last couple weeks. In any other situation, I would condense all my notes and thoughts into an essay. Because this is digital scholarship, I want to at least try and use some interesting methodology, some tool that would make this information visible ~in a new light~. After much brooding over Neatline, ArcGIS, and Omeka, my dissatisfaction with each of the methodologies stemmed that I was trying to change my information for the tool, not the other way around. I was considering using the tools for the sake of the tool  – that was definitely out of line from the general guidelines we drew up during the first couple weeks of the internship: the tool was meant to enhance the data, not the data existing for the sake of the tool. So out go all those ways of showing the data: Neatline was cool, but I see no reason to use a geographical tool for 4 buildings on the same small plot of land. :/ ArcGIS was just WAY to big and extensive  for the small project I aiming for. Omeka… is… Omeka… Just… Look at it and know that it is not am appealing project host…

I had accepted my not-too-interesting project format. If the natural traditional form of my research would be an essay, the natural digital form would be an exhibit. With the incredibly visual focus of the collecction and the archive in general, this is a path that works. The WordPress theme we have chosen – Pond – has a gallery feature that can function as an exhibit.

Looking nice B-)
Looking nice B-)

(Ive just realized this post has no bulletpoints. Go me.)

From my conversation with Kelcy and Sarah I also narrowed my scope once more, going from 11 buildings constructed during Hitchcock’s time at Amherst to 4 that are the most interesting examples of his impact on architecture (Morgan Library, Appleton Cabinet, the President’s House, and the Octagon) to just one – the Octagon. (The process reminded me quite a lot of the phrase “You could stop at five or six stores… or just one“)

So my choice is now only one. The most interesting one. The most ~*^iconic^*~ one (I guess living on campus really dulls your appreciation for the aesthetics of the more common wow-architecture? I remember arriving and being like “Wow! Octagon!”  and that is definitely no longer the case).

Anyways, I am now completely narrowing down. Putting that info in with gr8 pictures. Finding some conclusions about Hitch’s involvement into WordPress. Yes. That is the plan.

m/

Send Help Seanna is Dying Over Here

So I’m prefacing this post with the fact that I’m now two weeks late and I have technically been working on it since the original assignment date, but that there is just sooooooo much work to be done that I then put this off. Coincidentally, I still have so much work to get done that this will be a brief post. (Yes, even more brief than usual heheh) Commence original post: (by the way, Daniel came up with the title of this post so I can’t even take credit for that heheh)

So we’re onto week 8 and last week was our designated data collection period, in preparation for the final project. Up to this point, we’ve been doing quite a bit of individual work, seeking out data and doing some preliminary organization before we really dig in, convening merely to bounce ideas off of each other and to discuss possible platforms on which our final project will live. We’re winding down now, and the pressure is on in terms of making this cohesive project actually materialize. Personally, my week of data collection was long and painful, but in the best way possible. The methodology with which I approached my specific project (the conversations on the overlaps in science and Christianity during Hitchcock’s career) was to go start by going through the tables of contents of publications in which Hitchcock himself had frequently published in an effort to gather a list of relevant names for a possible mapping and network analysis visualization. I found the publications which I would use through some secondary source research (again, thank you Stanley Guralnick for all of your footwork) and then went though the tables of contents for each, lifting the names of scholars specifically talking about things relevant to Hitchcock’s own writings. Some of Hitchcock’s own interests included the timetable of the Six Days of Creation, Miracles, and the deluge. His overall philosophy was that every word of the scripture could be somehow illuminated or proven directly through the exploration of natural science.

Edward Hitchcock Social Network Analysis (1)

Here is a not-as-intuitive-as-I-would-like preview of one of the visualizations that I created (in lieu of finishing this post on time, of course) I used Gephi to create this particular visualization, and it took about half an hour to get the nodes and edges (circles and lines haha) to appear, and then the duration of my day to get the labels to appear. Needless to say, I underestimated how long it would take and how difficult it would be get my desired results after gathering and mining my data. But then again, who WOULD anticipate taking almost six hours to make a few names pop up on a visual? Am I just the clueless one? I digress.

In any case, we’re starting to come back together now that we will need to have our website assembled VERRRRRRRYYYY soon. We’ve done some post-it note models of the information architecture and began discussing what times of information we will need to provide in order to give context and unity to our four smaller projects. It feels like quite a time crunch, but I am quite confident in our team and our ability to pull it together. In the meantime, I need to make these visualizations more comprehensible and pretty. So until the next post!


1 Thing a Digital Scholarship Intern Said In a Blog Post [Sponsored]

It is ironic I have been prompted to write about how my project «will benefit from a team-based approach» as an individual (though not necessarily as an artist who respects creative integrity and intellectual property). I think it like enough immeasurably more valuable to discuss directly with my fellow interns just how they could «shape, amplify, improve and implement [my] piece of the project» than to conjecture as much alone, in a blog post somewhere between the back o’ Bourke and Woop Woop, enclosed by this series of tubes we call “Internet“. Nevertheless, I write on, thinking (rationalizing?) the exercise will prove to be useful in due time.


I have left the above introductory paragraph to ferment as a draft in my WordPress dashboard for a half-week now, supposing that an answer to the then-unanswerable question of how others may augment my project would reveal itself to me via a Seussian dream ripe for psychoanalytic interpretation. Alas, no Muse has left such a phantasmagorical present for me. Yet I am not surprised, considering how many of the countless personality quizzes I have taken (most notably the Myers-Briggs Type Indicator and the Enneagram test) along with my co-interns have said I am not a model team player, to understate my results. Bluntly 16personalities.com says, «Active teamwork is not ideal for people [like me] with the INTJ personality type»; the Enneagram Institute likewise states, «Eights [like me] are the true “rugged individualists” of the Enneagram. More than any other type, they stand alone. They want to be independent, and resist being indebted to anyone.» Similar to the Leaning Tower of Pisa and the world’s largest cowboy boots, my inability to expatiate on the merits of teamwork is a small wonder.

I do not mean to suggest even remotely I think the members of my team dimwitted and thus incapable of contributing anything of value to my own endeavor. I merely offer an explanation for why I am experiencing so much difficulty coming up with ways in which a team would be able to enhance my project. Then again, maybe I have been uncharacteristically quick to write off the possibility that I will not use my team as a resource, that I am too much of a black sheep, lone wolf, loose goose, or any other name for an individualistic (and sometimes unruly) animal / Amherst restaurant (look it up).

At my most Panglossian, I believe my team can aid me by simply being there, by entertaining my questions and nodding their respective heads at my at times needy appeals for approval. And that really is all I need to elevate my final project—the understanding endorsement of others.

You Won’t Believe What Happened After They Started Researching!

Blog Post: You’ve each been exploring individual project ideas that will be part of a larger whole, but as some of you have already noted, these projects will benefit from a team-based approach. How will you use the team to shape, amplify, improve and implement your piece of the project?

1) Actually exchange information about what we have been doing.

  • We’ve mostly kept to ourselves during the last week – I’ve been in the Archives’ small room, looking through documents and getting pages upon pages of strange information about the buildings I have decided to look further into: Appleton Cabinet, Morgan Library, the Octagon [Woods Cabinet and Lawrence Observatory], and the President’s House. My best object was an art history class essay written in 1996 about the decades in which these buildings and a couple others (namely Williston and Barrett Halls). The argument of the essay was that the 1840’s and 1850’s brought about a new dimension in learning through these different, specialized buildings. College Row, built during the religiously zealous second president’s term, is  cemented in one dimension; the Octagon and Morgan Library, when they were built, added some dimension in both the academic areas of the college (with an expansion of science and specialized learning) and in the single-plane of the College Row. It’s a very artistic description, but it works.
  • There was this great moment on Friday when we were all sitting in Barker (for one rare moment), when all of a sudden we realized no one had an idea about what everyone else was doing. “SOOOoooooo what have you been up to this whole week?” was the prevailing question.

2) I have quite a lot of information, random things, interesting things, tidbits and curiosities, but I am unsure about how to organize them.

  • Some relevant examples:
    • The minutes of the Trustees’ meetings say that, on Nov 5th, 1833: “Voted to cause  house to be erected for the use of the President, provded the present one can be sold for a sum not less than $2500.” In January, an offer arose. The Trustees decided to accept the offer. “Voted that the TreasurerEach of the College be directed to borrow from the Amherst Bank such sum or sums of money as may be necessary to fulfill the contracts for the building of the President’s house” etcetc. The new one cost $9000.
    • Reason #3 why Charles H Hitchcock wrote “The Visitor’s Guide to the Public Rooms and Cabinets of Amherst College with a Preliminary Report” was a hope for donations.
    • Each room of the Octagon had a name for a prominent donor. Apparently the college was that desperate to show their thanks for the benevolence of Josiah Woods, Charles Baker Adams, and Abbott Lawrence. Also the Octagon w as built in 1847-48 – the actual literal years of the worst of the debt crisis. Nicely done, Hitch.
    • Morgan Library had an open stack structure when it first opened, along with four paintings on the walls: the three college presidents and Aristotle.
    • The Dewey Decimal System was initially created for Morgan Library. Dewey was one year out of college (he graduated in 1873 I believe, from Amherst) when he was asked to help organize the increasing library collection.
    • Apparently when Morgan had free-standing stacks people flipped because that was a revolution in library organization. :/
    • The Assyrian Reliefs have been in nearly all these buildings: they were bought by Hitchcock because he hated Williams (the tl;dr version). He had heard that Williams and Dartmouth had secured Nimrud Reliefs for their collections. He contacted a recent Amherst grad, Henry Lobdell (Class of 1849), who was stationed in Persia, to procure some for the college. Lobdell agreed, saying that he could get better ones than them, and Hitch forwarded him $500 to do the job. Right now, that $500 is nearly $15,600.00 (Purchasing Power Calculator).
    • The cost of Appleton’s collections exceeded $5000 and every single document (and very few exist, unfortunately) mentions its fireproof nature. Apparently that was a big deal back then – fireproof buildings.
    • In addition, Appleton was built in 1855 from a fund for the creation of “benevolent and scientific objects” from the Estate of Samuel Appleton of Boston. Hitch applied in 1853 for funding; his request was approved in 1854. The building cost $10k; the collections inside, $5k.
  • Cool. Cool cool cool.
  • But my question is: how do I compile all these curiosities into an interesting exhibit?
  • Not sure, completely, but I did find some examples with the site that I am most interested in using.

3) Wix would be a pretty great. Really great.

Look at it! This is a really simple site I threw together from a sad template to show my thoughts after I initially vomited them onto the whiteboard  (which  does help with thinking, huge thanks to Dustan for introducing that idea of throwing everything we know on a whiteboard and then whittling away what does not matter). Next to the whiteboard is also a rudimentary post-it-note information architecture (pics unavailable D:). The main idea is that  the site content – the four projects – would be separate from the documentation of the  Behold!

http://bordarya.wix.com/edhitcharoo

Not the worst thing for a five-minute work of assigning badly-named pages to a usual template.

Here are some other sites that show the capabilities of wix, especially in projects similar to ours:

http://thepeytoncollection.wix.com/anniecpeyton

http://nlarsona.wix.com/genderedimagesms

This sleek, simple layout is basically what  I have in mind as well. Something that is flexible to showcase both data and gallery-esque visuals, and enough of a traditional layout to look good. Yes. Looking good.

TO conclude this post, here is a video of a great moment from a cartoon I am currently absolutely in love it right now:


Can We Guess What Your Learning Preferences Are With This One Question??

One of my favorite little things about this internship so far has been seeing how everyone in the group approaches our weekly blog posts so differently. Although we all are given the same prompt and have the same tools available for answering the prompt, from the beginning, each individual has made their blog post unique, distinguishing themselves with stylistic choices like bullet-pointed narrative, allusive featured images, or a first-person reflective voice. At first, I was surprised at the dramatic differences between the look and feel of all of our blog posts, but after a couple of weeks with the team, it makes sense. After we had a workshop that helped us determine our learning style preferences using the Kolb learning style inventory, it was apparent that the four of us all had very different preferred learning styles. Even where a couple of us elapsed in preferences, the determined way that we expressed those preferences was different.

The interesting thing about the Kolb inventory is that it presents the learning styles not as discrete, but all making up part of a cycle of learning that we all experience (albeit in different ways and at different paces).

So while my preferences fall in the “Assimilating” category (which prioritizes observation and thinking before any of the other steps), at some point I will have to move on to the next quadrant of thinking and doing, testing out the ideas that I’ve been conceptualizing.

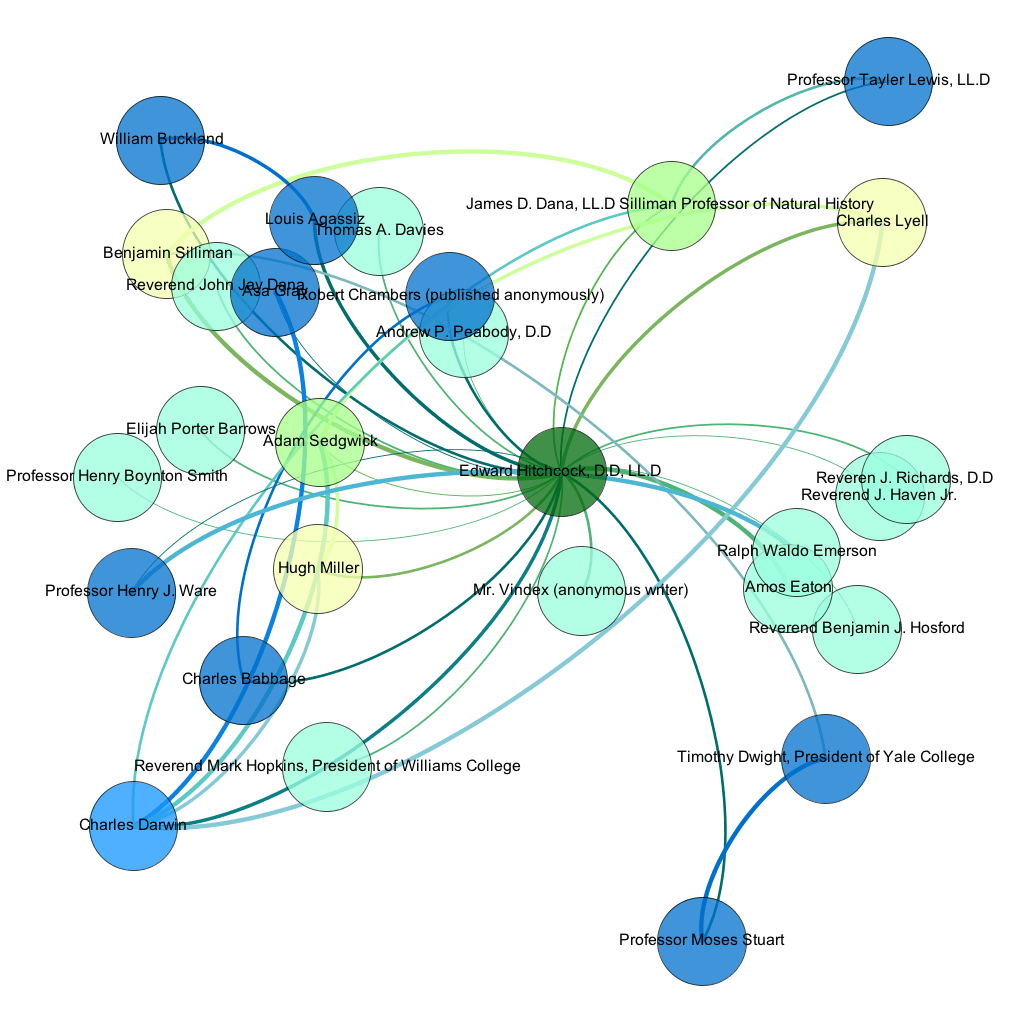
This is the point I feel as though I’ve reached in my section of the research project. I spent last week collecting a large amount of data on when five of Edward Hitchcock’s most important works have been cited, according to Google Scholar. I have a nice big Google Sheet with individualized tabs and lots of data. The question is, where do I go from here? The goal with this branch of the project is to map the network of Hitchcock’s scholarly influence after his death, but given the diversity of data I’ve collected, this could present itself in a variety of different ways. Do I map exclusively the numbers of citations and co-citations? Should frequently appearing authors or journals be connected in some way? Does that matter to us? (It might show that what appears to be a very widely spread network is just a network that is very insular, but active.) What about mapping with an emphasis on time and place? These are elements I’ve been very interested in recording from the beginning, and I think they also have some relevance with the data Seanna’s collecting, at least on a macro, if not quite micro level.

Screen Shot 2015-07-27 at 2.01.15 PM

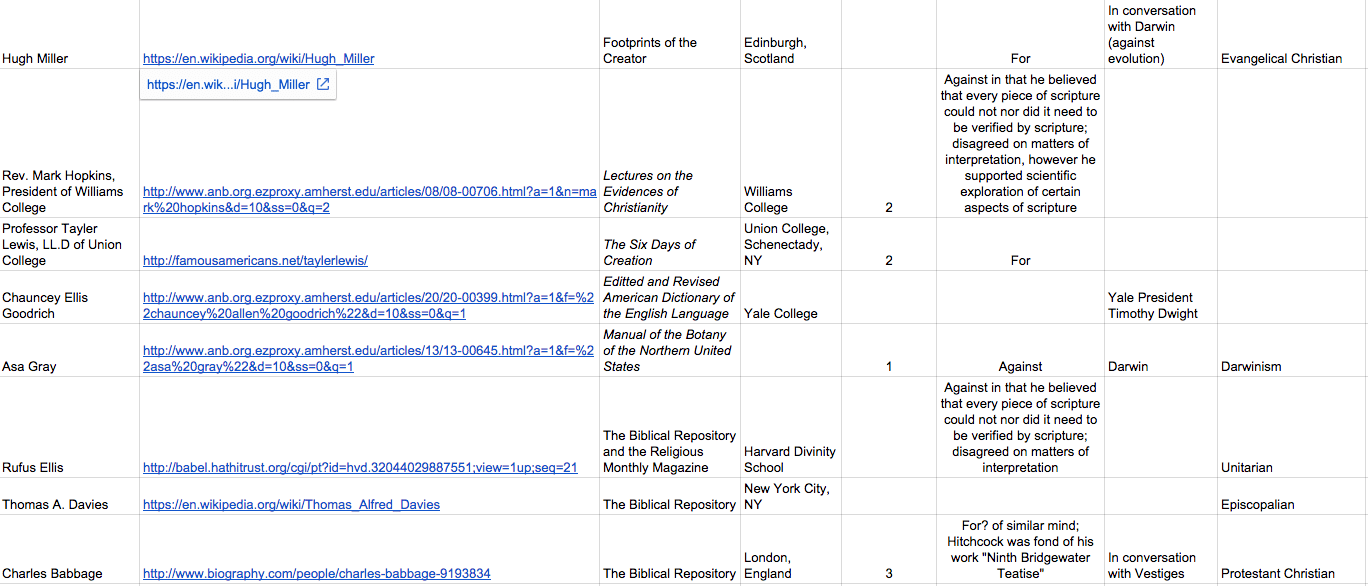
The time period of Seanna’s project is focused on the years of Hitchcock’s life, when he was actively publishing. Additionally, the data she’s been collecting comes from sources that were relatively geographically close to Hitchcock as well; the furthest source I’ve seen so far recorded is London. At first I was bothered by the lack of overlap in our data, but now looking at the scopes of our respective projects side-by-side, it seems like they’re natural continuations of one another that could easily segue back and forth. I’m envisioning two separate networks with different data focuses (foci?), but when you “zoom” in or out of one you reach the other. In the end, they’re both trying to measure Hitchcock’s relevance, influence, and effect on his intellectual peers.

This is my dream architecture, the two networks represented visually with zooming capabilities and detailed nodes. However, this is my imagined approach, one that is very visual and very attached to the network image that’s been fascinating me from the beginning. Like with the blog post, I’m approaching this project with a preconceived set of expectations for what it should look like. When I find myself hesitating about the direction to take my visualization (and especially in what data to include), I think that one way of moving forward could be turning to the team to see how they would approach the visualization. If we had more time (always, always, if we had more time), I would love to take a day or half a day to have sandbox time with the data and Tableau. During our Tableau workshop, we played around with some of the sample data sets provided on the site, and it was fascinating to see what everyone chose, and then how they chose to visualize it with the software. I think it would be a great brainstorming experiment to give everyone my data and tell them to mess around in Tableau and present it however they thought was best. If we want to get more complicated, I could ask them to arrange the data with an emphasis on a certain category or using a certain type of visualization, to compare and contrast how they (and a potential later viewer) might be interested in looking at the data.

I’ve been trolling around the Tableau website looking at the sample visualizations they have as a substitute for the above experiment. They really showcase the variety of options you have in Tableau for displaying data, which reassures me that there’s no set template for visualizing data in a certain way. I’m hoping that through some more experimentation, ideally with the input and aid of my fellow team members, we’ll be able to find a method of visualization that best showcases the network data.