Are you a 1910 Slang Word? Because You’re “Jamake”-ing Me Crazy

Despite all the Digital Humanities concepts, ideas and jargon thrown at us within our first 48 hours of internship, one question dominated my mind this morning.

“What the heck is a ‘Jamake’?”

I’d encountered the term while reading the Kidder, a 1912 humor zine that was quite sophomoric for the time (although I’d argue that all publications in a college should be at the very least 25% sophomoric, if only for proper class-year representation.) The student editor, one Frederick Barton, had sent a draft to esteemed writer and troublemaker Elbert Hubbard. Hubbard, impressed with the rebellious display, wrote a kind letter in response. The editors would run Hubbard’s approval in the same issue, a trophy of witty delinquency.

Barton

Remember the good ol' days when world renowned authors invited you to sip lemonade on their porch because of your college magazine? I'm still waiting to hear back, Margaret Atwood. 

Reading his kind regards, I was left wondering what quality “jamake” could describe. Google searches turned up nothing. I texted my grandma at lunch and she never responded (crossing finger she didn’t pass away but too right now too call). Not until later did I realize the truth.

Jamake is plural.

The singular is “Jamoke,” a slang term from the late 19th century to describe a fool. The phrase arose from Irish American slang, particularly those working in shipping ports. It’s a combination of java and mocha, new words in America that had yet to be made cliche by Starbucks. To call someone a jamoke, apparently, is to say they no greater mind than that of a cup of coffee. It would rise to prominence in the trenches as slang for an army men, and like Tang, classic rock and the US presidency, would pick-up a less savory definition in the 70s.

Questions like these make me excited to spend real time looking at Amherst’s publications (unfortunately it’s not quite as easy to appreciate that old, mildewy book smell when you’ve gone digital.) I’ve written for a good number of our papers and magazines, but one thing I’ve found lacking is a sense of community and history within them. Students email their drafts, never step a foot in the office and don’t even know each others names. If it weren’t for the icons attached to their gmail address, I wouldn’t even know my editor’s faces.

My guess is that it’s hard to talk about legendary writers for The Student because it boasts such a massive, unwieldy history. Publication controversies, successes and tragedies come and go, but aren’t well recorded because they are ultimately covered up with the slog of boring candid sports photos and fluff news pieces. If an American icon were to contact a publication I wrote for, it probably wouldn’t even trickle down to my level. It seems a little ironic how the gatekeepers of Amherst’s daily history, have almost no knowledge of their own past. That’s all a little bit too selfless for me. Hopefully this jamoke can rectify it.

Learning to Ask Questions

It’s now the end of our first full week of the Digital Scholars internship (and the beginning of the second, by this point), and it seems that the wish I made last week (that I could return to school) has been granted, in a way. As we began to learn about our first two DH tools and try a hands-on exploration of applying them to the Hitchcock collection, I began to feel that I was going to have to reexamine everything I thought I knew about research, and maybe even relearn how to go about forming research questions.

This might not sound like the most ground-breaking of revelations, but as someone who just spent a year of her life working on a senior thesis, I thought I had the whole “research” thing pretty much down (and so begins the breakdown of post-graduate hubris). I was used to coming to a research project with a solid comprehension of my source materials, a clear grasp of what tools I had on hand, and most importantly, an outline of where my argument was going to go. Even with my thesis, which naturally grew and changed in unexpected ways over the course of the year, I had a good sense that I was in control of the texts and the outcomes throughout the process.

Not so with the Hitchcock Collection so far. First off, it’s certainly the most extensive assortment of source materials I’ve ever tried to examine as a collective. Given the nature of the materials, it’s challenging to find a cohesive focus throughout: this is a collection of artifacts from two peoples’ lives, from intimate diaries to professional correspondences to receipts of their daily finances. There isn’t a distinct “argument” at work here that I can parse out and examine, as I’ve grown used to doing in my research. And while getting to know the extensive collection (26 boxes!) well will be a long-term process that I hope will bring gradual comprehension as the summer goes on, the very nature of the tools we will be using to approach the collection ensures that any potential research questions will be in a near-constant state of flux.

This helpful diagram from a Trevor Owens article we read last week explains how digital tools and methodologies should inform a potential research question, with an emphasis on this continual state of refinement and adaptation that bothers me so much. Basically, we have so many options for tools and content that there is no one obvious way to approach this project; it seems like half the project is going to be figuring out what the project is going to be about… a process that is taking some getting used to on my part.

We’ve learned about two digital tools or approaches so far–Omeka, an online exhibit platform, and GIS mapping–and have looked at and critiqued a variety of examples of scholarship that makes use of each tool. Given the visual nature and focus of these tools, a lot of the examples we’ve examined so far have been visually interesting and outwardly arresting, but banal in terms of content or contribution to their actual field of research. The tool should fit/add to the research, we keep saying in a DH-style echo of the traditional literary adage “form follows content.” And it makes sense, but in examining and being entertained by these projects, I can see how easy it could be for our own project to fall into a similar trap of prioritizing the tool over the research itself. I personally am very easily seduced by interactive maps and visuals, and each time we examine one, I find myself getting excited about the tools not for what they could bring to the collection, but for how we could apply the collection to the tool.

When I try to think in the other direction, pulling out a research question or theme first, and then finding a tool to apply it to, nothing seems to quite stick. This might be because the themes I’m interested in right now don’t easily break down into to the visual or quantitative data that the tools we’ve looked at so far seem to prefer. I don’t even have concrete questions at this point, more just threads or themes that I’ve seen in the collection that I’d like to look into more: Edward’s reconciliation of science and religion; Edward and Orra’s familial relationship; the source and nature of his hypochondria.

I’m hoping that as we move along into this week of exploring more diverse and potentially more textually-based tools (text analysis, topic modeling), I’ll be able to find something that is more applicable to the themes and questions I’m interested in, and that from there I’ll be able to think more creatively about the collection and the rest of the tools.

Week 2 – beginning the trials

Forming, storming, norming, performing. We’ve got it down.

  • HOW IT’S DONE: We’ve  started learning the various methodologies used in DH –  currently up to Omeka exhibits and geographical mapping. Each tool-learning experience starts with a little “evaluate these other projects that have used these tools” session in which we basically critique other projects, making notes about how what we should take from their example or do differently.
  • OMEKA: After learning the  tool with small demos, we proceed to write a bunch of concept maps and research questions. For the Omeka exhibit, this worked fine: 4 concept maps, one brainstorming session, and we had some topics. Although our facilities dealing with concept maps were exhausted, we had some idea of where we were going.
    • Interestingly, the most fruitful discussions about research questions and concept maps come straight from the blue – from Kelcy’s “what if” questions and Daniel’s spontaneous tangents. One of these discussions arose during a concept map session (the last one, god bless). Someone suddenly asked, “What if we observe Ed and Orra’s achievements from a modern lens?” Suddenly, the tedious brainstorming (we had just done it so much in such a short time!) had an outcome – we had another point of view that created interesting questions we had not seen before. The “legacy” aspect of our project intrigued me the most.
    • These are just two examples of concept maps - including the one we used to create the final exhibit prototype!
      These are just two examples of concept maps – including the one we used to create the final exhibit prototype!

      IMG_20150618_110556

  • For the Omeka exhibit prototype, we settled on a topic that arose from the “modern lens perspective discussion”: Ed and Orra’s impact on the interacting fields of Art and Education. The themes chosen were simple yet interesting: Edward, usually thought of as the scientist in the pair, had some projects of creative merit, and Orra, “accomplished artist,” was a trained and published botanist and scientific illustration. This role switch added another dimension to their characters – no longer were they known simply by their reputation.
  • In addition, this topic choice – Art + Education – was perfect for a visual  exhibit. We had the visual element in the title: art! We included as many images as we could for each of the respective pages we were doing.
    • During the session on actually creating an information architecture – where we basically create a site layout, with pages, subpages, themes, etc. The navigation for the site.
    • I’m particularly really proud of how this worked out – the group came in  at 9 am, threw our tired selves into this post-it note creation, and ended up with nothing. After a while of blank staring, I reshuffled the post-its into a cohesive format – Orra and Ed’s individual achievements on one side, Orra and Ed’s collaborative projects on the other, with more concrete pages stemming from those three broad categories. The end result had the unusually sleepy cohort blinking  awake – look! here’s something that makes sense! B-) go me
    • The end result of our informational architecture machinations. AKA "should we draw lines or put markers or just leave it how it is?"
      The end result of our informational architecture machinations. AKA “should we draw lines or put markers or just leave it how it is?”
    • Here’s the end result for the Omeka workshop! (X) Not all the pages have content, but here is the one that I made: (X)
  • MAPPING: Following the Omeka workshop was one on geographical mapping. Cool stuff. From the very beginning, I was particularly interested in mapping and maps and geography because what is more inspiring that the image of a world map? That view slowly eroded. The various mapping examples we looked at had me asking the same question: “Why are maps used in these situations? What does a map do that another tool couldn’t?” It was fairly disenheartening to see that a tool with such interesting potential had no use that I could  concretely see (with the exception of http://worldmap.harvard.edu/africamap/ this one is an adventure with all its interactive content)
  • We skipped the mapping process for the mapping protoype and went straight to research questions. The end result is a mess of questions, but the final one remains – what does the mapping tool add to any of these questions?
  • What an engaging mess. Fortunately, we actually had some interesting ideas spaced in here concerning the geographical aspects of the Hitchcocks' legacy
    What an engaging mess. Fortunately, we actually had some interesting ideas spaced in here concerning the geographical aspects of the Hitchcocks’ legacy
  • We then split into  two groups, making two prototypes. I was in the pair with Seanna that had to observe the movements of the Hitchcocks during their travels and plot them on a map using Orra’s diary entries. For this, we used TimeMapper, a simply and accessible tool  (although some Harvard graduate gave it a 1-star review – “this is so simple! there arent enough options with this tool!” yes mister, that is the point – simplicity!)
    • My partner had a health emergency, so I took on the diary entries myself. It was not easy.
    • "Don't we have interns to do this tedious work for us?" say the interns themselves
      “Don’t we have interns to do this tedious work for us?” say the interns themselves
    • Anyway, here’s my less-than-fruitful result. Sarah and Kelcy came over and the three of us together had a hard time getting this done, reading the locations and trying to find out the specifics with Google. “Is there a Gallahan Castle in Cologne? Which country is Cologne even in?” In the end, we knew more about the River Neckar than we ever needed to. Huge thanks to Sarah and Kelcy too – their help actually made my prototype exist. The prototype can be found here: (X)
  • LUNCHTIME: In addition, we met with the DH post-bacs. An interesting pair –  Jeffrey Moro (his twitter is here) and Mariel Nyröp. They brought up some interesting points about the politics of DH, the various limitations that each tool and methodologies use. The idea is that every tool has a certain communication to it and requires thoughts and ideas  to be delivered in that fashion, which may exclude people incapable to communicate in that manner. This was not a topic that we had discussed previously (although it was mentioned). That was my big takeaway from this lunch (other than the thought that people who are not official scholars also work in the DH field), but even then, the post-bacs themselves told us that “It’s like a filter. You have to decide when to turn on the politics and when to turn it off to actually get work done.”
  • This was one of the first images on Google for "politics digital humanities." It's a fairly common topic in DH tbh (according to the post-bacs)
    This was one of the first images on Google for “politics digital humanities.” It’s a fairly common topic in DH tbh (according to the post-bacs)
  • THE END: Otherwise, we’re working on the abstracts and methods for the last two projects, doing readings, living and breathing. Woohoo.  Last Friday, Daniel turned on some music ridiculously loudly in the room. The day ended with some soft partying to songs that shouldn’t be repeated. This morning on the way here, Flavia (who is working in the Archives for the summer) held the door to Frost Library for me and said, “You guys were playing music so loudly that I was finishing shelving to ‘Trap Queen’!” Because that’s what we do in Digital Scholarship, DH, the DigiShip, Diggy Human Dept. We party and write and research. Rock on m/

Introduction to All

What questions do you have after the first couple of days?

I arrived a bit late, but even after half a day of discussion and a couple of hardcore reading hours I’m filled with thoughts. We have not answered the question of “what is digital humanities” – and, for now, agreed not to have one, or to at least allow it to have its vagueness for now.

In addition, while I am all completely for the use of digital tools to look at primary sources and data, Daniel’s constant question, “What does the digital add to the project?” Many of the projects we looked at could have been done in a physical form rather than a digital one. Victoria’s second map from last year’s project, while incredibly appealing, could be made with some ingenious sliding mechanisms in a book. The linguistic analysis piece could have also been done by hand, albeit painstakingly.

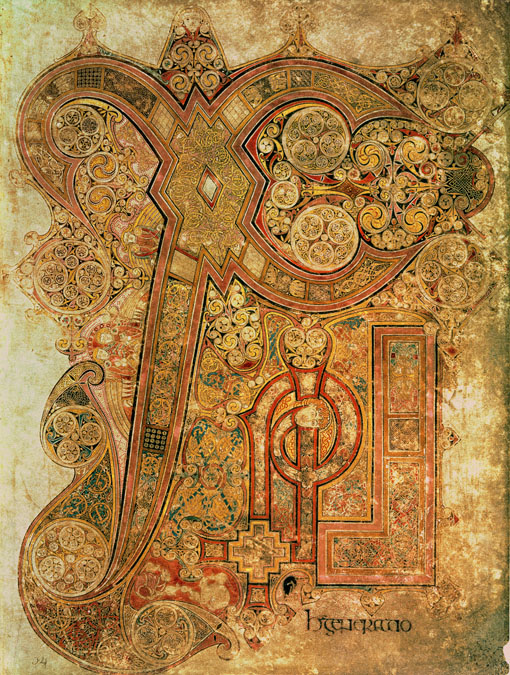
As I’m thinking about the proper usage of digital humanities that helps the viewer better understand the material, I remembered about the Book of Kells, an Irish calligraphic version of the Bible made circa 800. I took a 3-day calligraphy class in high school; we watched the animated movie, “The Secret of Kells” (fantastic, unique, imaginative, 9/10, would recommend), gained a newfound appreciation for the book, and then proceeded to observe the book itself, in all its intricacy and beauty, through a digital collection of Trinity College in Dublin. What followed then was a practical demonstration of Irish calligraphy and then our own student trials of pen and ink. The movement from digital media to practical hands-on experience really solidified the small course and brought the students the most benefit in the most constrained time – a quality of efficiency that I hope to emulate in the less-pedagogical-more-research-oriented project.

This is the most famous page of the Book of Kells, the  Chi-Rho Page, named for the large character. 

Compare this image with Trinity College’s digitized version, which allows a fantastic amount of zoom (you need to scroll to folio 34 r to see it).

I’m not yet sure what  to do with this example yet except keep it as a model for a context where the use of DH helped more than hindered.


What are you particularly interested in exploring/learning this   summer?


I would like to know more about the concrete tools available for digital scholarship, which I suppose we as a team will be introduced to through workshop-like elements. Perhaps I can learn to tweak them to my advantage! After looking through the Edward and Orra White Hitchcock Finding Aid, I’m curious about seeing where their two strengths aid each other – his curiosity about dinosaur footprints, geology, and natural theology, and her accurate depiction of all things in the natural world. In addition, it would be interesting to compare the lecture notes that he used for teaching alongside her drawings, perhaps see the accuracy of their paired project as compared to current scientific drawings of the same objects.

What are you hoping to get out of this experience?

Most of all, a new range of skills that I could then carry on and use in other areas. My work with the Archives & Special Collections in the fall showed me alternative uses of traditional media – I’d like to see what else is possible with it. In all else, I know that everything I will learn will not come from me declaring it but rather living through the experience. I look forward to learning about these tools, researching the interesting people who are Edward and Orra White (who I have to explain and re-explain to all who ask me what exactly I am doing with my summer internship), and producing an insightful project with equally awesome people that can help others understand the interesting lives of our subjects.

Put a Bow on It! A Summer’s Worth of Digital Scholarship Comes to an End

It’s been a while since we’ve last posted, but not for lack of activity. Like a trio of academic bees, we’ve been buzzing around the library for the last several weeks, working hard on our digital projects and the larger website that houses them. With the projects completed and the internship coming to a close, we encourage you to visit our site, DH Blueprints: Teaching Digital  Humanities by Example. Like the tagline suggests, we’ve created and presented our digital projects as the focal point of this educational sight with the intent of providing models for students and teachers to learn more about what goes into a digital project. We’ve also included a wide range of information that we hope gives a broad overview of digital humanities, from its origins to contemporary interests within the field to its terminology.  Continue reading Put a Bow on It! A Summer’s Worth of Digital Scholarship Comes to an End

Where Am I and How Did I Get Here?

My individual digital scholarship project, which is now part of our collaborative ‘meta-project’ around digital scholarship, has changed a great deal in the last few weeks. And it’s changed even more since I first began to envision what our collective digital project would be. Initially, I wanted to explore a project that would map the publication data of the Native American books collection. Then, I wanted to plot geographic locations within various books to see what Native American authors were writing about a given region in the U.S.  over time. And now, I’ve shifted to using text analysis programs and methodologies to compare two different Iroquois creation stories written by Tuscarora authors. How’d this happen? Continue reading Where Am I and How Did I Get Here?

Reviewing Jing and Animoto by Using Jing and Animoto

We’ve been looking at different programs that might help us, either as a form of digital storytelling related to the books or as a way to introduce our project. Two programs on the table today are Jing and Animoto. Jing is a screen capture program and Animoto makes video slideshows. To switch things up, I decided to use the programs to give a demo of each. You can click here to check out my short demo for making a slideshow in Animoto. And here is my slide show on Jing. Continue reading Reviewing Jing and Animoto by Using Jing and Animoto

Coming up for Air: a Brief Recap on a Week of Research

Last week, we interns had free reign to do our own research relating to a digital project proposal for the KWE Native American book collection. This meant lots of time exploring different books and articles related to Native American studies and digital humanities tools that could be useful for our digital project. I broke up my time reading and gathering info on two broad subjects that tended to overlap as I began to hone in on what I was interested in. In the one corner, there was Native American literary history. In the other, studies related to the history of American publishing and of American print culture. In many ways it was a week of info dumping- searching catalogs for articles, skimming said articles, checking bibliographies, looking up books… you get the idea. With that said, I think an important take away from this is that there is so much to learn about the fields I’m looking at. That can be daunting, but it’s also cool to be exposed slowly but surely to something new. Anyway, I have a few more takeaways that might be best served as questions.  Continue reading Coming up for Air: a Brief Recap on a Week of Research

Maps on Maps on Maps

Out of the different forms of data visualization that my fellow interns and I have begun to explore, geographic information systems (GIS) or mapping tools have remained one of the most interesting options to me. And for good reason. First off, as a tool for displaying information, maps and mapped data in general begin to shape a story about your data. Put another way, your data really has a chance to saying something once it’s been mapped. For example, trends and outliers within lotted publication addresses from pre-20th century Native American books will reveal themselves and because you’re looking at an image/display, perhaps an interactive (clickable, zoomable) one, that info sticks in your brain more. And we’re all about that here. Continue reading Maps on Maps on Maps

How in the World?

How do we, everyone working on this project, talk about the KWE Native American books collection as a whole? What sort of project and what kind of tools could make something that speaks to the whole collection? For some reason, I’m particularly interested in broad questions of place concerning these Native American books- How for instance would we present geographic- info on where these authors are from or where their books were published-in a meaningful and accessible way?

Continue reading How in the World?